
rayisa/iStock via Getty Images
Thesis Summary
Bitcoin (BTC-USD) fell as low as $17,000 last month and it has since rebounded strongly to over $20,000. Over the last few weeks, we have seen both good and bad news for Bitcoin and the overall crypto market.
In this article, I try to give a balanced analysis by outlining “the good” in terms of on-chain metrics and imminent bullish potential, “the bad” by looking at data and critical support levels, and “the ugly,” a potential Bitcoin “Black swan” which could really shake up crypto in the coming weeks.
The Good
In my last article on Bitcoin, I talked about how the world’s first cryptocurrency had fallen below its realized price. Put simply, the market as a whole had now entered into losses. In the past, the realized price has acted as a strong line of support, with Bitcoin corrections only dropping under this level for a few months or even weeks before an upward trend resumes.
I also pointed to the fact that we needed to see a five-wave rally off the lows to begin to think bullishly, and this is indeed what we have seen:
BTC reversal (Author’s work)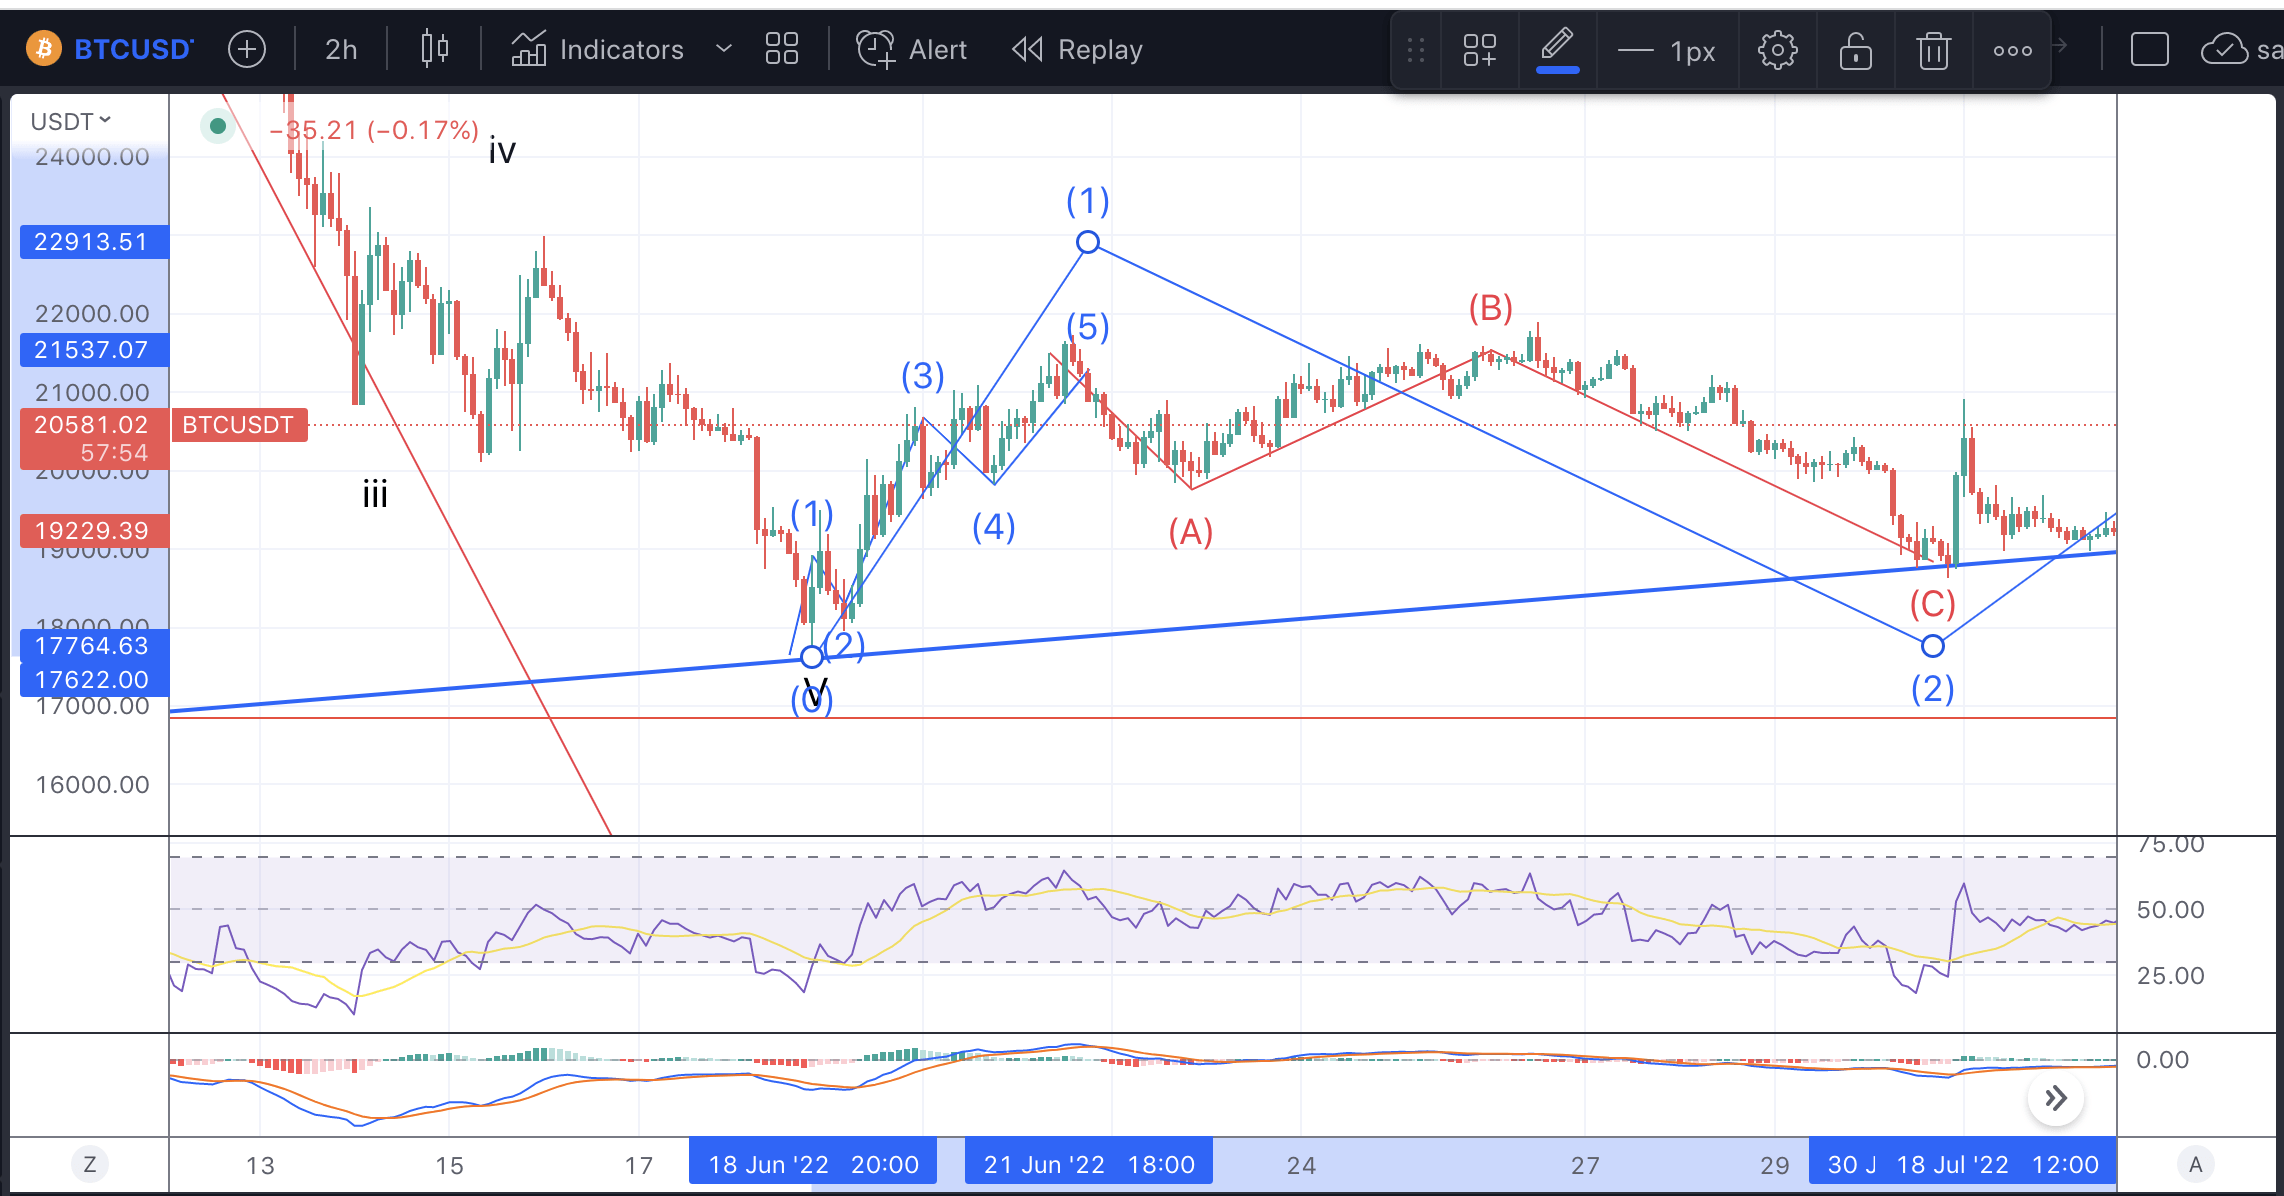
We had a very clear impulsive reversal, followed by a corrective move down. Furthermore, we have held the support trend line in blue so far, in every pullback.
On top of that, we can also point to bullishness from on-chain data. We have seen a growing trend of BTC, as well as other cryptos, leaving exchanges. And where are these coins going? Most wallets have little history of spending, what Glassnode calls illiquid supply. This means less selling pressure available for Bitcoin, at the same time, we are seeing an all-time high in BTC addresses with a non-zero balance.
The Bad
So. While we have strong evidence that, at the very least, we are nearing the end of this capitulation, we also have reason to suspect that BTC could head somewhat lower in the coming weeks.
One of my biggest concerns is the number of bankruptcies and restructurings we have seen, as well as the capitulation of miners, which are being forced to sell Bitcoin reserves and even shut down operations.
The long list of bankruptcies/liquidations includes Three Arrows Capital, Voyager Digital (OTCPK:VYGVF) and the Celsius exchange (CEL-USD). Meanwhile, Bitcoin miners like Riot Blockchain (RIOT) are struggling to keep up mining production and are being forced to sell their reserves.
The big problem here is that as long as Bitcoin prices remain around these levels, liquidations will continue, and so will miner capitulation, putting even more pressure on the Bitcoin price.
While the BTC price has recovered, it still hasn’t broken above the most immediate levels of resistance, these being the 200-week MA and the Realized Price.
200-week MA and realized price (Author’s work)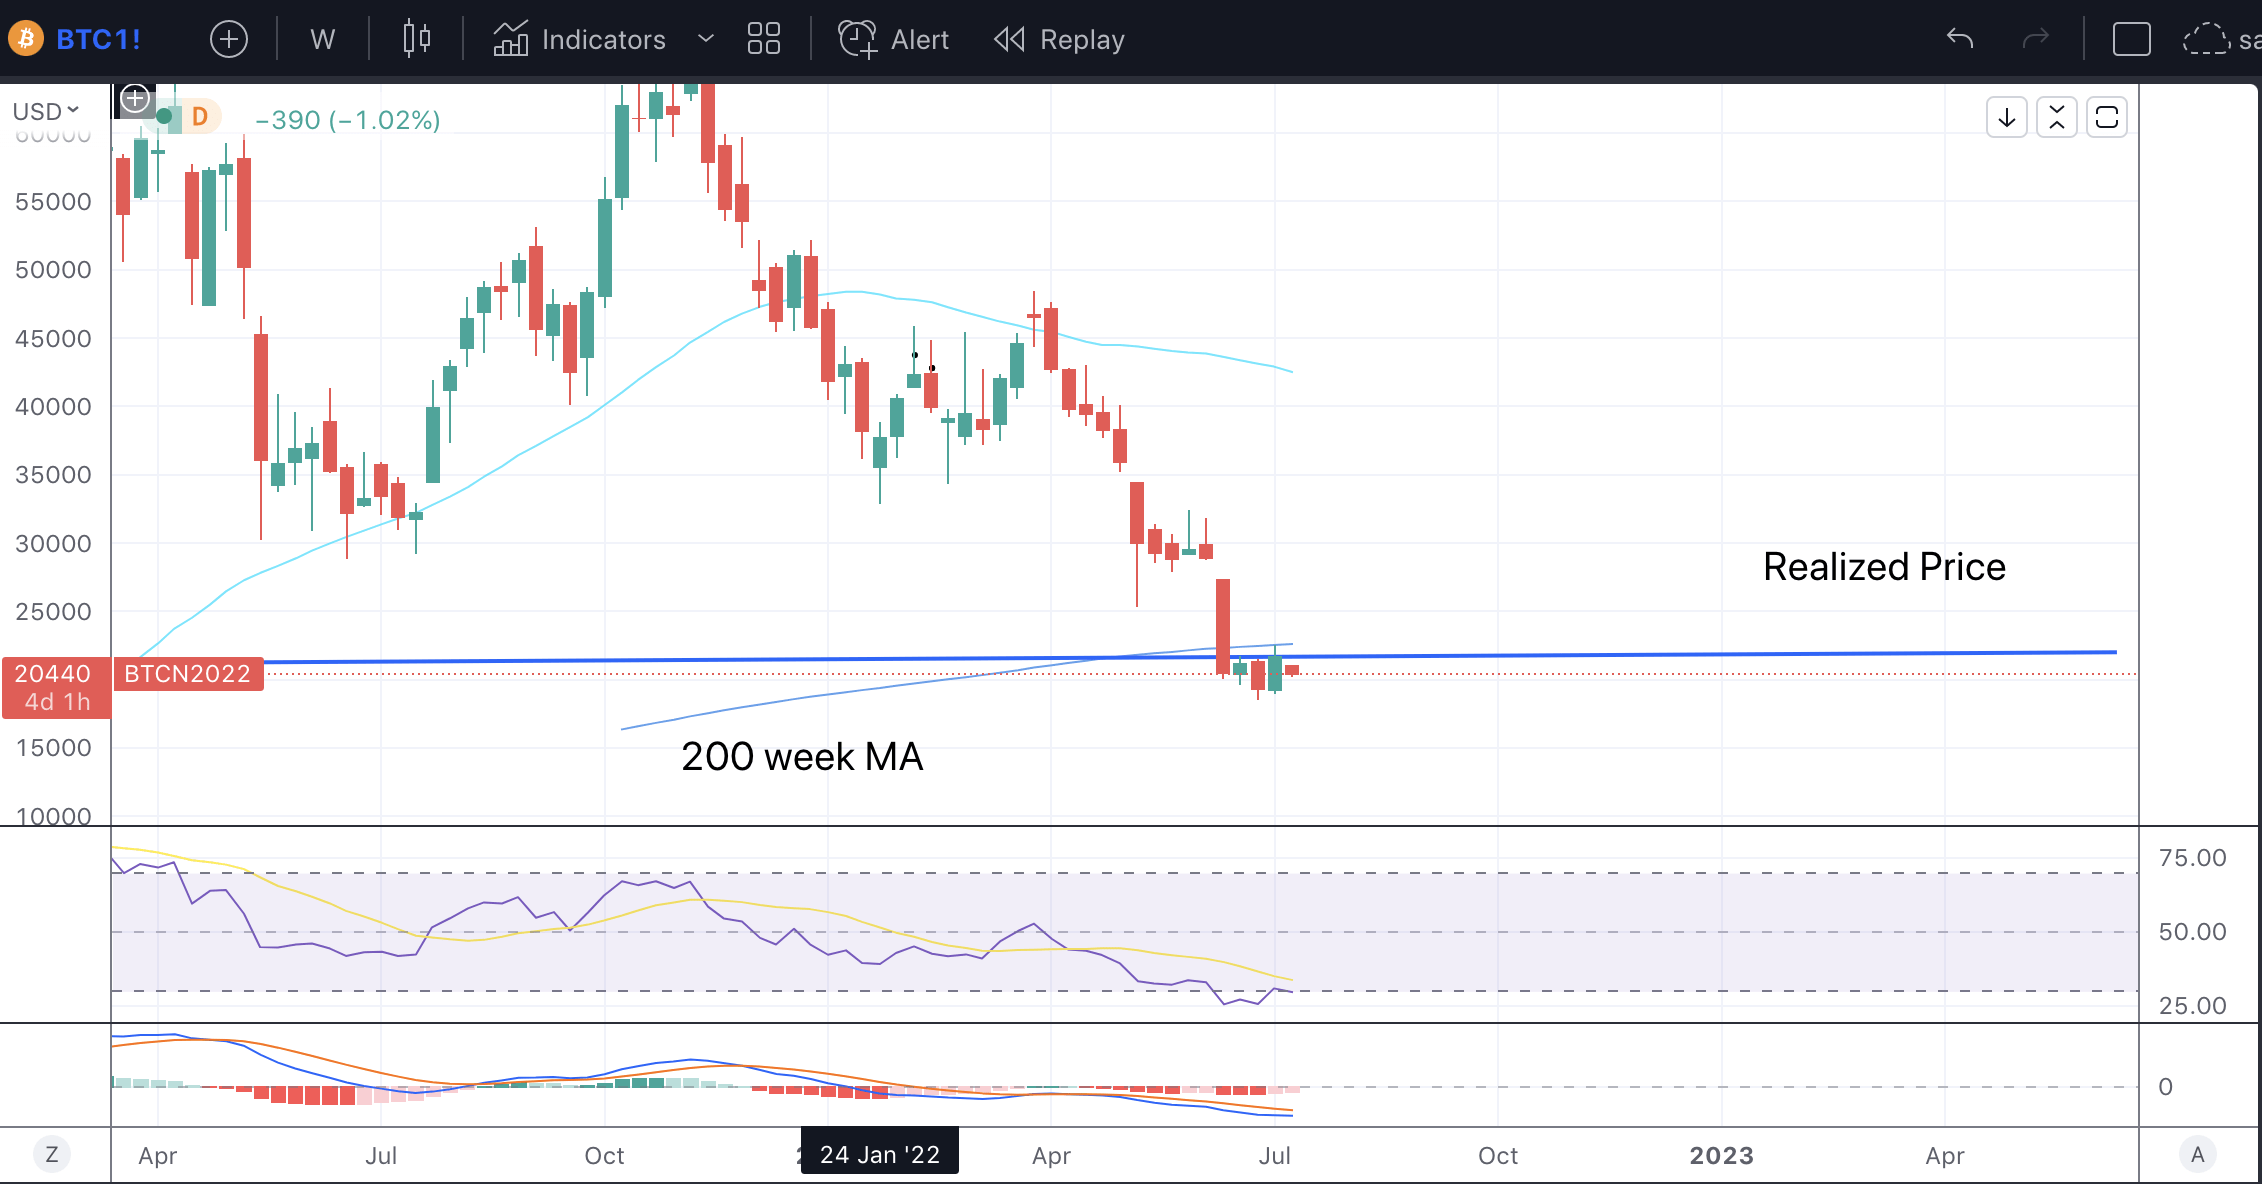
The Realized price currently sits around $22,180 while the 22-week MA sits slightly above that. These two key levels which I have talked about before used to act as support for BTC, but now they are the resistance level that must be broken to continue higher.
Bitcoin got rejected at the 200-week MA and is now below the realized price too. With this in mind, we might head to the next key level of support. The Delta Price, which is derived from the delta, was developed by David Puell. This is obtained by subtracting the average cap from the realized cap. Or the average price from the realized price. The average cap can be defined as follows:
Instead of setting a fixed period for calculating a moving average (e.g., a 200-day MA), this is a life-to-date, cumulative simple moving average that serves as the true mean of the whole history of market cap. Due to its “laggy” nature, it is the perfect mechanism to help decay the upward speed of delta caps over time.
The Delta Price was last reached in the 2019 sell-off. The current Delta Price is around $14,700, so this is the next key support level of the recent low.
The Ugly Black Swan
Last and certainly not least, I’d like to talk about an idea that has surfaced in the last few days regarding a possible “Black Swan” for Bitcoin.
This story involves Mt. Gox, one of the first crypto exchanges to exist. Mt. Gox suffered numerous security breaches during its existence. Back in 2011, it suffered its first hack, but by 2013 Mt. Gox accounted for 70% of Bitcoin’s transactions. In a subsequent breach in 2014, Mt. Gox announced that it had lost close to 750,000 of its users’ bitcoins and another 100,000 of its own Bitcoin reserves.
Fast-forward to today, and after much litigation, a “Rehabilitation Plan” was put into action in 2021 to repay creditors. On July 6th, creditors received an email stating that the “Rehabilitation Trustee” was getting ready to make payments.
All of this to say that in the next few weeks, we could see around $3 billion worth of Bitcoin released to these creditors, who have the option to redeem this in Bitcoin, Bitcoin Cash (BCH-USD) or Tether (USDT-USD).
While it’s hard to predict what creditors will do with this Bitcoin, dump or hold, this sell-off has the potential to be even bigger than the Terra (LUNA-USD) collapse, which saw $2.4 billion worth of BTC sold in an attempt to maintain the Terra peg (UST-USD).
Takeaway
In conclusion, there’s still a lot to process regarding Bitcoin. I am still bullish long-term and hold that we are nearing the end of this capitulation. That said, we need to break resistance above soon, or Bitcoin will head lower. The Mt. Gox hack restitution could be the catalyst for this final sell-off.
This news is republished from another source. You can check the original article here.
Be the first to comment