Bitcoin Analysis
Bitcoin’s price traded a bit lower during its daily session on Monday and when the day’s trading session had concluded, BTC’s price was -$206.2.
The first chart we’re looking at this Tuesday is the BTC/USD 4HR chart below by L_F. We can see that BTC’s price is clinging again to the historic high from 2017 just below the $20k level at $19,891.
If bulls can hold the 0.707 [$19,836.32] their first overhead target is 0.382 [$21,743.67] with a secondary target of 0.5 [$22,430.37]. The third target to the upside for bullish BTC market participants is 0.618 [$23,097.07]. The next major target on the 4HR time scale below that level is the 1.618 [$12,681.57] which is where a lot of experienced traders have prophesied could be the eventual bear market low for BTC’s price.
Conversely, bears are hoping to again send BTC’s price below its 2017 high and then the 0.707 before taking aim at the 0.786 fib level [$19,237.03].
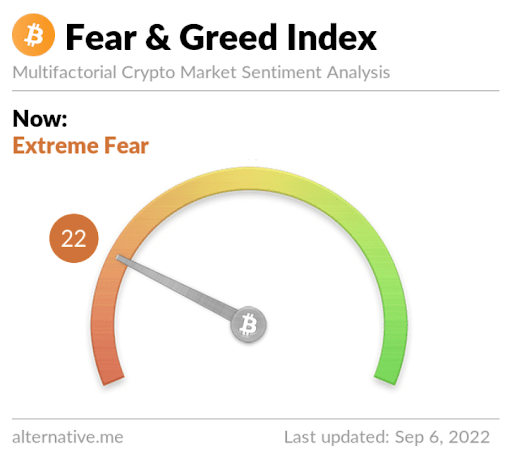
The Fear and Greed Index is 22 Extreme Fear and is -1 from Monday’s reading of 23 Extreme Fear.

Bitcoin’s Moving Averages: 5-Day [$19,996.79], 20-Day [$21,919.74], 50-Day [$21,778.33], 100-Day [$26,171.12], 200-Day [$34,860.46], Year to Date [$32,810.08].
BTC’s 24 hour price range is $19,633-$20,174 and its 7 day price range is $19,621-$20,504. Bitcoin’s 52 week price range is $17,611-$69,044.
The price of Bitcoin on this date last year was $52,663.9.
The average price of BTC for the last 30 days is $21,904 and its -12.5% over the same duration.
Bitcoin’s price [-1.03%] closed its daily candle on Monday worth $19,793.5 and in red figures for the third time over the last four days.
Ethereum Analysis
Ether’s price outperformed BTC’s price by more than 3% on Monday and when traders settled-up at ETH’s session close, ETH’s price was +$38.63.
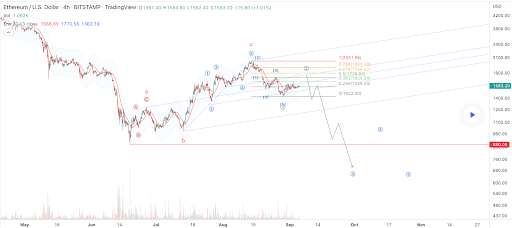
The second chart this Tuesday for analysis is the ETH/USD 4HR chart below by nanfinance. ETH’s price is trading between the 0.236 fib level [$1,566.09] and 0.382 [$1,655.04], at the time of writing.
To the upside of the chart bullish Ether traders are aiming for 0.382, 0.5 [$1,726.93], 0.618 [$1,798.82], 0.786 [$1,901.18], and 1 [$2,031.56].
At variance with bulls are bearish traders again looking to push ETH’s price below 0.236 with a secondary target at 0 [$1,422.30].

Ether’s Moving Averages: 5-Day [$1,571.96], 20-Day [$1,707.87], 50-Day [$1,515.70], 100-Day [$1,774.35], 200-Day [$2,508.41], Year to Date [$2,294.00].
ETH’s 24 hour price range is $1,556.65-$1,676 and its 7 day price range is $1,483.85-$1,676. Ether’s 52 week price range is $883.63-$4,878.
The price of ETH on this date in 2021 was $3,927.43.
The average price of ETH for the last 30 days is $1,690.48 and its +0.66% over the same timespan.
Ether’s price [+2.45%] closed its daily session on Monday worth $1,617.49 and in green figures for a second day in a row.
Polkadot Analysis
The last chart we’re looking at to round-out our price analyses for this Tuesday is the DOT/USD 1D chart below from EdgarTigranyan. DOT’s price is trading between the 38.20% fib level [$7.42] and 50.00% fib level [$7.85], at the time of writing.
Bullish DOT traders have their sights set again on breaking the 50.00% fib level with a secondary target back over $8 at the 61.80% fib level [$8.27]. Above that level the targets for bullish DOT traders are 65.00% [$8.29], 78.60% [$8.88], and 100.00% [$9.66].
Those that are short the DOT market are looking to push DOT’s price back below the 38.20% fibonacci level with a secondary aim of 23.60% [$6.89]. The third target below for bears is a full retracement back to 0.00% [$6.04].

DOT’s 24 hour price range is $7.26-$7.64 and its 7 day price range is $6.9-$7.64. Polkadot’s 52 week price range is $6.05-$55.
Polkadot’s price on this date last year was $34.34.
The average price of DOT over the last 30 days is $7.92 and its -8.7% over the same time frame.
Polkadot’s price [0.00%] closed its session even on Monday and was worth $7.37 for a second consecutive day when traders settled-up.
This news is republished from another source. You can check the original article here.

Be the first to comment