Ethereum
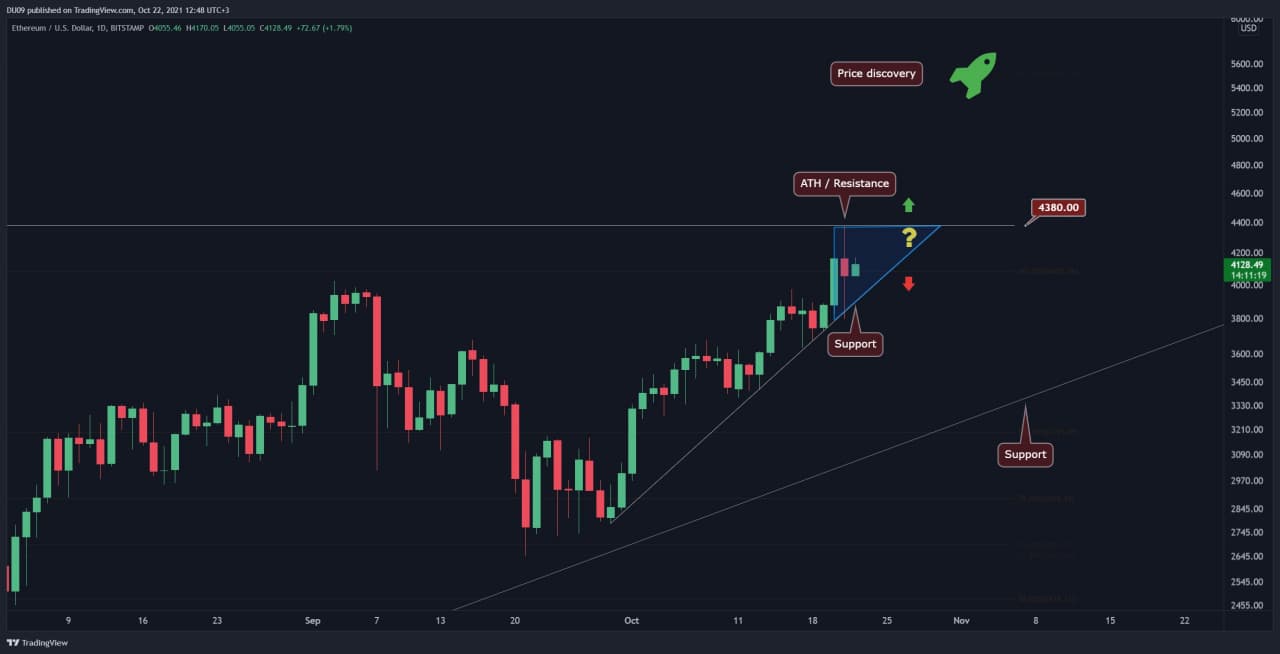
This week, Ethereum managed to rally over 8.5% and nearly touched the all-time high at $4,380, missing it by $5 (Bitstamp). The momentum remains bullish and the price is in a steep uptrend as shown by the trendline which is currently acting as support around $4,000. A break below this level can push ETH back to the next support found at $3,500.
The resistance at $4,380 continues to hold, at least until another attempt is made by the bulls to break it. Considering that in the past week Bitcoin has set a new all-time high, the overall market is heated in expectations of further gains in price. Ethereum, as the second-largest cryptocurrency, is looking set to take the spotlight in the upcoming week as well.
Looking ahead, Ethereum can see an amplification of its uptrend, particularly if the price breaks the all-time high. Despite any pullbacks, that are normal in a rally, ETH could easily set new highs in the coming weeks which would trigger a race until a top is found.
Cardano
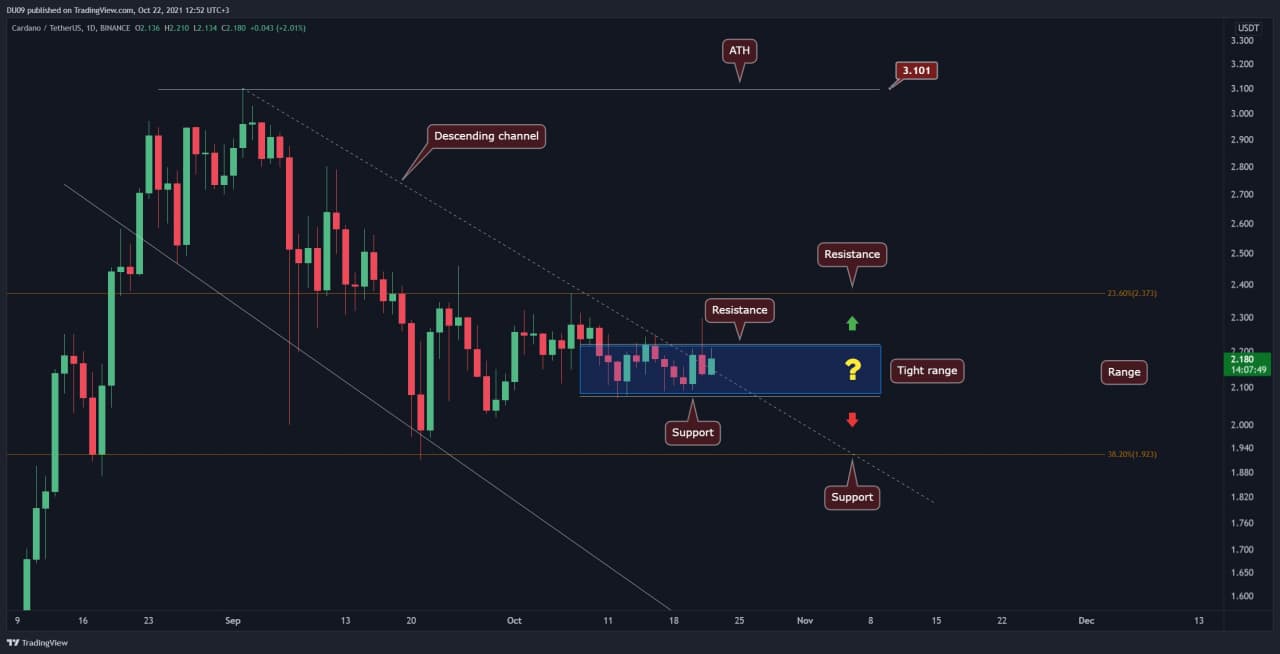
Cardano managed to break away from its descending channel after several attempts. Now, ADA’s price finds itself in a tight range between $2 (support) and $2.2 (resistance). This price action is within larger confinement that was set back in late September between $2 and $2.4. Therefore, until ADA breaks away from it, the trend is flat and the price can bounce between the key levels indicated on the chart.
The indicators on ADA give signs of some optimism for the bulls. A retest of the $2.4 resistance seems likely in the coming week or as soon as the price breaks away from the $2.2 resistance.
Looking ahead, ADA’s all-time high is still far away at over $3. Before such levels can be reached again, the cryptocurrency has to pass the key resistance at $2.4. Any failure to do so could trigger a rejection back to the key support levels at $2.2 and $2.
Ripple
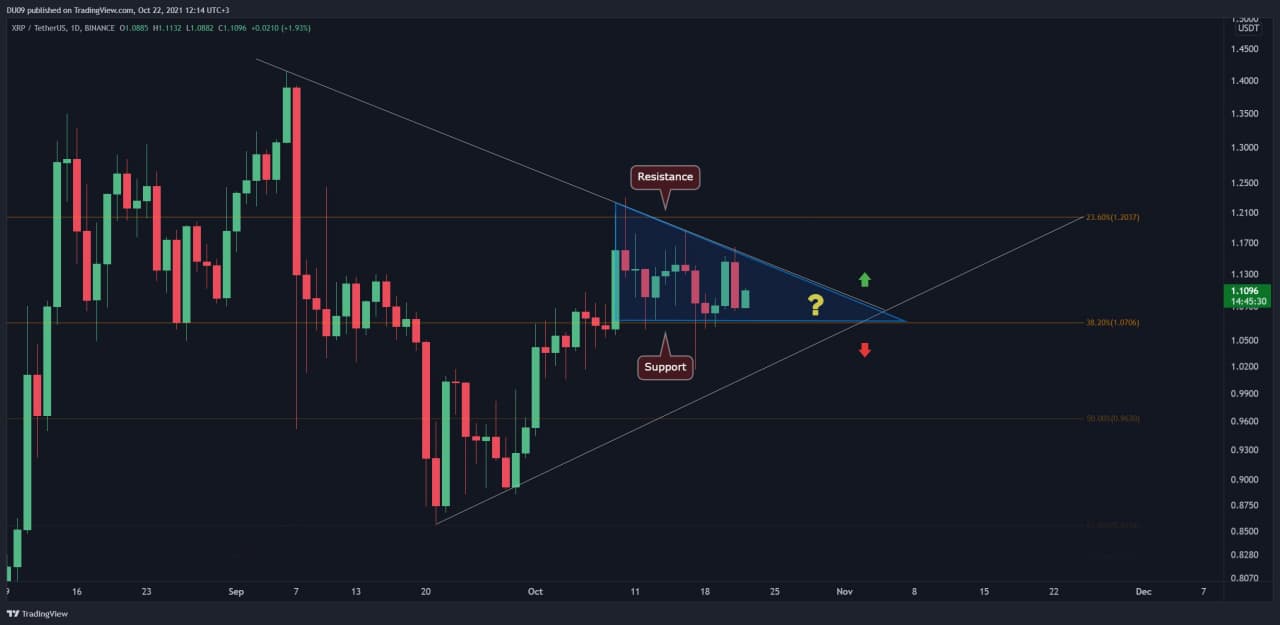
Ripple’s price action in this past week disappointed with a flat trend. XRP bounced several times between $1 (support) and $1.16 (resistance) forming a descending triangle. Nevertheless, the upcoming week promises more exciting price action due to the compression against the downtrend resistance line. The expectation is that price can break away from the apex of this formation in blue at which point a change in trend can happen.
Until then, XRP is bound to be stuck between the support and resistance levels. The indicators suggest a bearish bias due to MACD crossing on the negative side this week. However, without the price breaking below the support level of $1, it is too early to assume XRP will fall to lower levels.
Looking ahead, the all-time high for XRP sits comfortably at $3.3 and was never retested since January 2018 when it was set. There was an attempt in April 2021 to approach it, but the price was sharply rejected as soon as it reached $2. Since then, XRP has been consolidating below $2 with the hopes that another attempt to reach the all-time high can follow in the future.
Polkadot
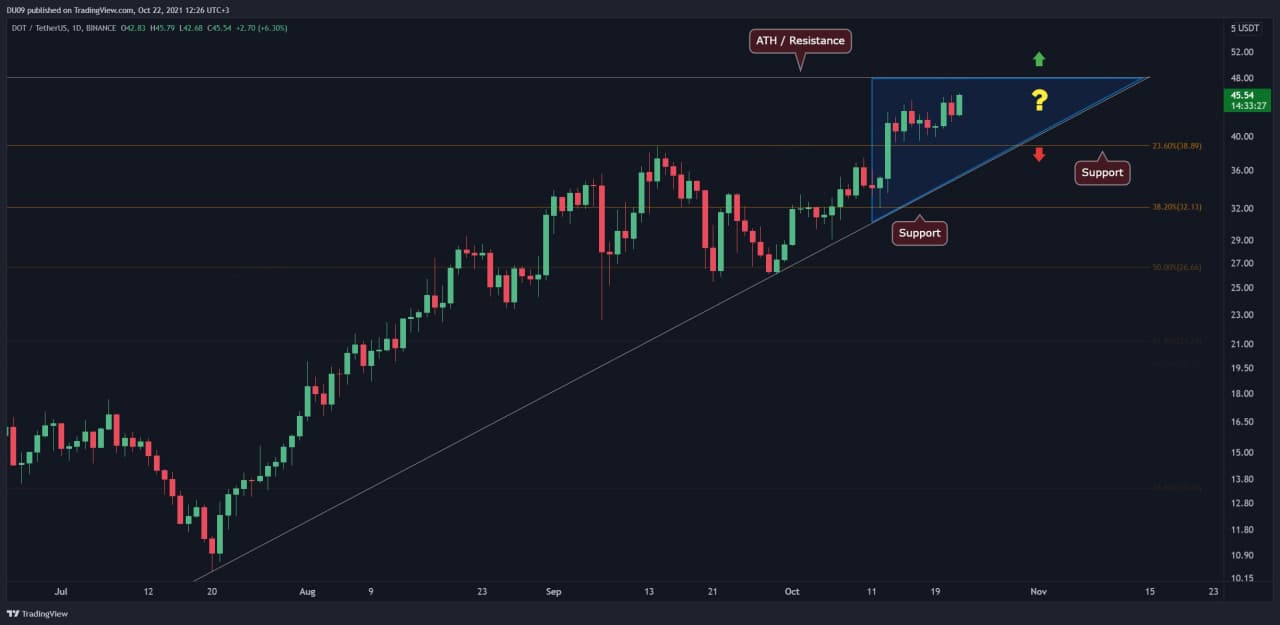
DOT has continued to make sustained gains in this past week after breaking the key resistance at $39 on significant volume. There is some anxiety in the price action currently because DOT is less than $5 from its all-time high just under $50. Therefore, profit-taking at this level is likely and the bulls have to show a lot of strength to avoid a rejection below the resistance line indicated on the chart.
There is still room for the price to move in the coming week within the blue apex (see chart), but by early November DOT’s price will have to take a decision on the next steps. Can it set a new all-time high or can the bears take DOT lower to the support levels found at $39 and $32? Patience is key.
Looking ahead, the anticipation of a retest of the all-time high is on the mind of most DOT holders. The indicators are bullish at the time of this post, therefore a retest seems likely in the current market context.
Solana
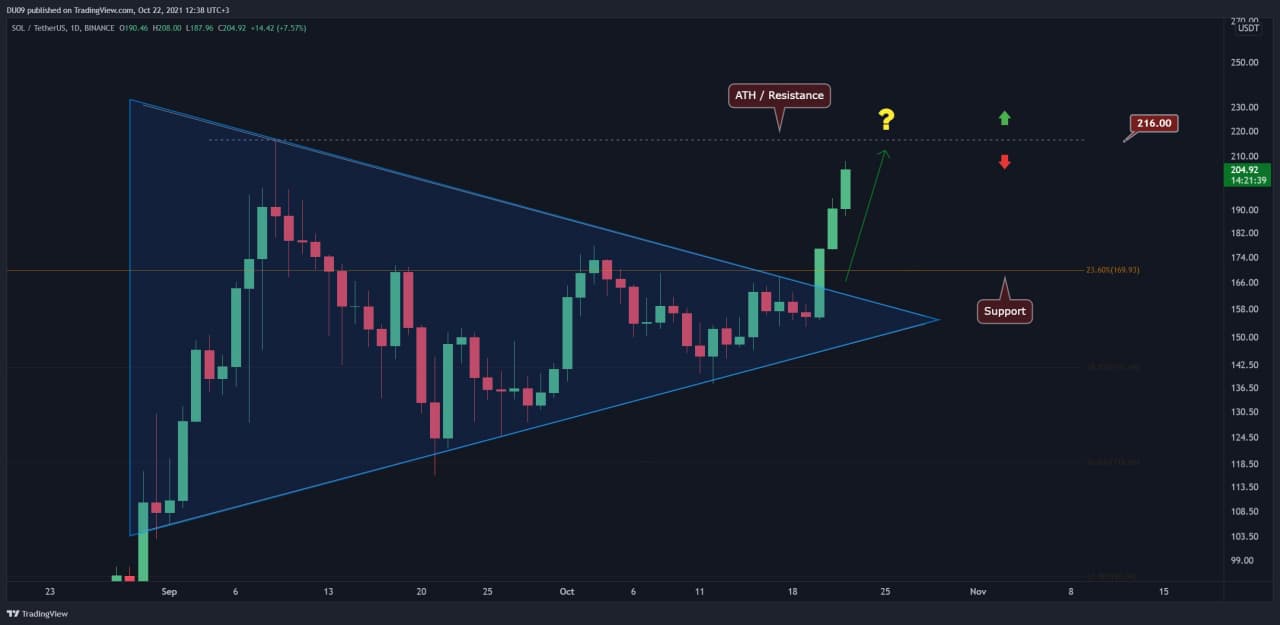
This week SOL had a stellar performance after breaking above the large pennant in blue with over 35% increase in price. This bullish move was anticipated in our last analysis as the most likely scenario based on the indicators. After confirming the breakout, Solana moved very fast towards the key resistance line at $216 which is also the all-time high. At the time of this post, SOL is less than 5% from the ATH.
Considering the bullish bias on the indicators and the sustained rally since the break above the blue pennant, the resistance at $216 is likely to face mounting pressure in the coming days. If the bulls sustain this further, a break above can become a reality by next week.
Looking ahead, SOL has good support at $170 in case of any rejections at the resistance level. However, a break of resistance appears more likely at this time. It is important to watch closely the price action around the $216 level.
Binance Futures 50 USDT FREE Voucher: Use this link to register & get 10% off fees and 50 USDT when trading 500 USDT (limited offer).
PrimeXBT Special Offer: Use this link to register & enter POTATO50 code to get 50% free bonus on any deposit up to 1 BTC.
Disclaimer: Information found on CryptoPotato is those of writers quoted. It does not represent the opinions of CryptoPotato on whether to buy, sell, or hold any investments. You are advised to conduct your own research before making any investment decisions. Use provided information at your own risk. See Disclaimer for more information.
Cryptocurrency charts by TradingView.
This news is republished from another source. You can check the original article here.
Be the first to comment